
What rate of renewal?
The correct rate of renewal for a farm varies depending on the state of the pastures, and the goals of the operation. This section covers how to assess pasture performance across a farm and plan accordingly.
Rate of renewal
Pasture renewal programmes vary widely across NZ, ranging from 0% to over 30% of the farm area each year. Dairy farm renewal averages about 8% compared to 2-5% on sheep farms. The percentage of a farm renewed also determines how long a pasture must last, for example a 5% rate of renewal means a pasture must last 20 years.
Often the amount of land renewed is a set figure in the farm’s annual budget. But it shouldn’t be. Renewal should be flexible, and weighed against other investments. For example on one farm we assessed, a programme to immediately renew over 30% of the property was undertaken, as the poor performance of existing pastures made this a very profitable strategy.
Benefit of renewal
The benefit of new pasture is the gains it will deliver over existing pasture. So it's important to estimate the current pasture performance versus potential.
Current pasture growth
Pasture growth varies widely between individual paddocks across every farm. On flat farms there is typically a 100% difference in DM yield between best and worst paddocks. This difference is much higher on hill country properties.
Growth differences between dairy paddocks of 4 t DM/ha are common. This means poor performing paddocks may produce 250 kg MS/ha less than better ones (based on 75% utilisation and 12 kg DM/kg MS conversion). On a sheep and beef farm the poorest paddocks could be carrying 30-50% fewer stock with slower animal growth rates.
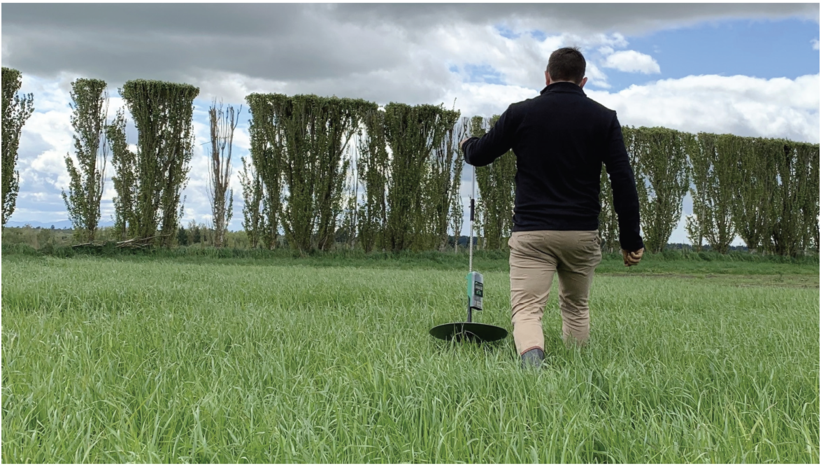
Measuring paddock performance
Comparing the performance of individual paddocks allows you to quantify the potential gains of pasture renewal on the farm. The best paddocks show what can be achieved, with the difference between those and the worst illustrating the potential for improvement, provided paddocks share similar topography, soil type etc.
One way to find out how much individual paddocks grow is to record stock grazing days. For more advice on doing this, visit www.barenbrug.co.nz.
Alternatively you can use a plate meter or visual yield estimates from farm walks to estimate pasture cover to calculate paddock growth. Some software does this automatically from weekly pasture cover data.
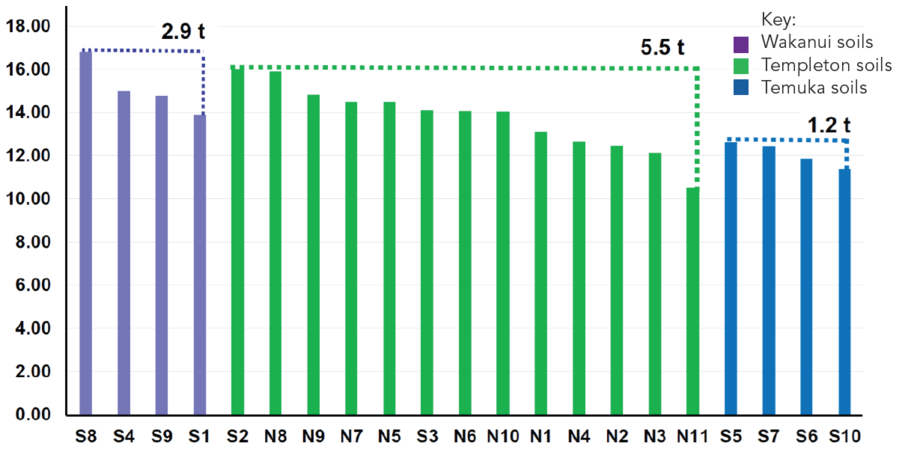
Create a paddock profile
Paddock performance data can be used to rank paddocks within their productive group (e.g. different soil type, topography etc). This example is for the Lincoln University Dairy Farm (LUDF), which has three different soils marked by different colours.
The soil types have different productivity, so you need to compare paddocks within each soil type. This identifies the potential of poorer producing paddocks within a soil type, for example N11 producing an estimated 5.5 t DM/ha less.
Just as farmers identify and cull the 'tail end' of their herd or flock to improve animal performance, here the same thing is done with pasture, culling tail end paddocks to lift farm pasture performance.
Example of paddock performance on LUDF divided by the 3 soil types
Low hanging fruit
While the graph above shows the potential gain from renewal, it's also important to look at the cost or difficulty in realising those gains. The best return from investment in pasture renewal is from significant yield gain achieved at a low cost. Look for your worst performing paddock(s) on the most productive part of the farm.
For example on the LUDF, DM yield gains are typically much easier to achieve on the green soils than the poorly drained blue soils, on which gains also rely on drainage work, which increases costs.
Evaluate success
Continuing to assess paddock performance after renewal allows you to evaluate the success of pasture renewal. Typically pasture renewal delivers good gains. If this is not the case, underlying reasons for poor paddock performance probably have not been rectified. Continual evaluation allows farmers to fine-tune renewal techniques to identify what works best for their particular system.
Capture benefits of new pasture
New pasture grows more so:
- More fertiliser will be required.
- A higher stocking rate may be needed.
- Change in management systems may be needed.